In analysis, edge data can seem to be missing. This is due to analysis parameters and calculation methods. We have one data point for every subset. We report the data in the center of the subset. For this reason, the closest we can report data to the edge is one half of the subset size. If you draw the area of interest right up to the edge, then the software is tracking all of that data in the drawn area of interest, but the edge data will be reported in the center of the edge subset. To get the contour plot closer to the edge you can use a smaller subset, which means you'll need a small speckle pattern. With an ideal speckle pattern of 5 pixel speckles that are densely speckled 5 pixels apart, you can likely use a subset size of 9 pixels. This means that in the ideal case, you can get your contour plot within 4-5 pixels of the edge. Also, physically zooming in on the edge will enable you to use a smaller speckle pattern and that 9x9 subset will also be physically smaller, so the center of that subset will be physically closer to the edge. Again, if you zoom in on the sample, you’ll need to adjust your speckle size so that you’ll be able to track a small 9x9 subset. One a side note, since subsets and filters report data in the center of the subset/filter, we need that center point. This is the reason that we must always use odd numbers for subsets sizes and filters. Even numbers do not provide the center point that we need in order to report the values.
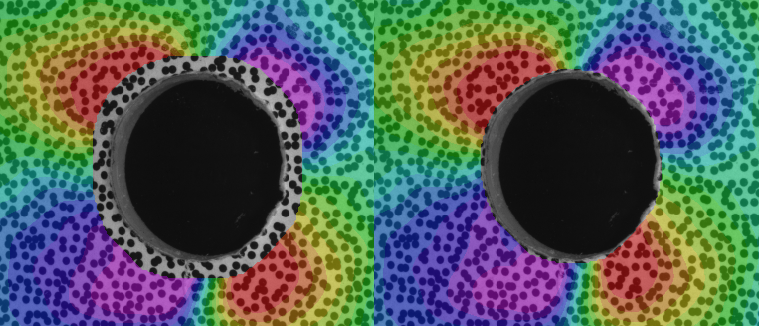
There is an analysis option called "Fill Boundary". This option uses incremental correlation to fill in the partial subset sized area on the edges. Checking this option will cause the analysis to produce data all the way out to the edge of the AOI. The data is interpolated from multiple subset gradients using an intelligent optimized algorithm. The resulting output data is compared in the figure below.
Ethan Jarr
Comments